How to Read a Java Thread Dump and Find a Deadlock
A practical, evidence-first method for reading jstack and jcmd output, tracing monitor ownership, confirming deadlocks, and separating ordinary waits from incidents.
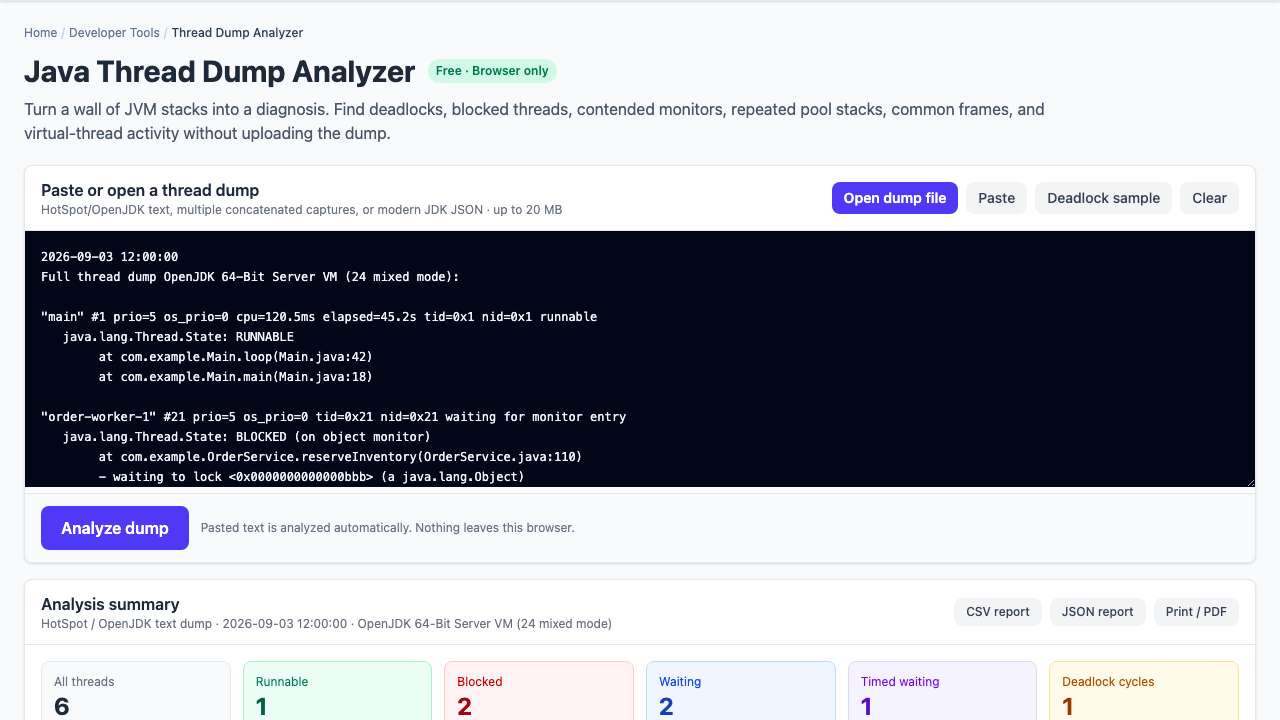
A production JVM stops making progress. CPU is ordinary, memory is not exhausted, and restarting “fixes” it. This is exactly where a thread dump earns its keep: it records every Java thread’s state and stack, plus the monitor locks the JVM can identify, at one moment in time.
The fast path: locate BLOCKED threads, note the monitor each one is waiting to lock, find the thread that already owns that monitor, and follow the chain. A cycle—A waits for B while B waits for A—is a deadlock.
Capture evidence before restarting
When the JVM is still reachable, capture more than one dump. A single snapshot can make healthy waiting look suspicious; repeated snapshots show which stacks are stuck.
# Rich text dump with lock information
jcmd <pid> Thread.print -l > thread-1.txt

# Capture two more, several seconds apart
jcmd <pid> Thread.print -l > thread-2.txt
jcmd <pid> Thread.print -l > thread-3.txt
jstack -l <pid> is also useful on supported JDKs. On Unix-like systems, kill -3 <pid> asks HotSpot to print a dump to the process output; it does not terminate the JVM. Keep timestamps and application metrics alongside the captures.
Read a thread block from the top down
Start with the thread name and Java state, then read the first few application frames. The top frame is where execution was observed; the whole stack provides context about how it got there.
"checkout-1" #42 prio=5 tid=0x42 waiting for monitor entry
   java.lang.Thread.State: BLOCKED (on object monitor)
    at example.Inventory.reserve(Inventory.java:88)
    - waiting to lock <0x000000071a01b2c0>
    - locked <0x000000071a01a110>
    at example.Checkout.submit(Checkout.java:51)
This thread already owns monitor ...a110 and is waiting for ...b2c0. Search the dump for another - locked <...b2c0> line. That thread is the current owner and the next link in the wait chain.
Recognize the cycle, not just the symptoms
"inventory-refresh" #57 prio=5 tid=0x57 waiting for monitor entry
   java.lang.Thread.State: BLOCKED (on object monitor)
    at example.Checkout.refreshPrices(Checkout.java:130)
    - waiting to lock <0x000000071a01a110>
    - locked <0x000000071a01b2c0>
Now the cycle is explicit:
checkout-1owns...a110and waits for...b2c0.inventory-refreshowns...b2c0and waits for...a110.- Neither can release its lock because neither can continue.
The durable fix is usually consistent lock ordering or less work inside synchronized regions—not a larger thread pool. A pool can add more blocked participants without breaking the cycle.
Do not treat every wait as a deadlock
| State | What it establishes | Common interpretation |
|---|---|---|
| BLOCKED | Waiting to enter a Java monitor | Investigate the owner and duration |
| WAITING | Waiting indefinitely for another action | Often normal for parked pool workers, joins, and conditions |
| TIMED_WAITING | Waiting with a deadline | Common for sleeps, timed parks, and scheduled work |
| RUNNABLE | Runnable from the JVM’s perspective | May be CPU work, native execution, or some I/O—not proof of high CPU |
A healthy server can contain hundreds of WAITING threads. The stronger signals are cycles, many request threads blocked behind one owner, the same application frame recurring across captures, and correlation with stalled requests or exhausted pools.
Use repeated captures for hangs and CPU loops
If a RUNNABLE thread remains at the same application frame in three captures, it deserves attention. If its stack moves each time, it may simply be doing work. Compare the evidence with per-thread CPU data, Java Flight Recorder, application metrics, or a profiler before concluding that a line of code is “hot.”
Virtual threads need a different scale of view
Traditional text dumps become unwieldy with large virtual-thread populations. Recent JDKs can write structured thread dumps with Thread.dump_to_file -format=json. The JSON preserves containers and makes grouping repeated virtual-thread stacks more practical.
A defensible incident checklist
- Preserve at least three timestamped captures before restarting when possible.
- Record the JVM version, process ID, host, traffic symptoms, and relevant metrics.
- Trace monitor identifiers from waiter to owner; look specifically for cycles.
- Group identical stacks to find pool saturation and shared bottlenecks.
- Treat thread names, packages, URLs, and SQL fragments as potentially sensitive.
- Confirm static evidence with repeat captures or runtime telemetry.
Privacy note: the Bug Days analyzer parses thread dumps inside the browser. Even so, review a dump before sharing screenshots or exported reports because stack traces can reveal internal class names, endpoints, and operational details.